
Infographics are the new wonder of the digital era. You can't scroll through social media for long, read blog posts thinking about current events, or even delve into reports without seeing one of the many colorful and informative infographics that float around online.
What exactly does an infographic do, and how vital are they for SEO? Infographics can be pretty powerful, so in this post, we will touch on a few things, including the benefits and types of infographics.
Table of Contents |
What is an Infographic?
An infographic is a way to show data or information in visual form. It combines text, images, charts, and icons to communicate complex information quickly. So, what is infographic design? It is creating visual representations of information, data, or knowledge. For example, rather than absorb a 1,000-word report, an infographic summarizing the key points in graphics and charts with supporting concise text will allow someone to grasp those essential facts rapidly.
Why Are Infographics Important in SEO?

In a world where attention spans are shrinking and content overload is real, infographics act as attention magnets. Visual content is processed 60,000 times faster than text by the human brain. That’s why marketers love infographics they turn skimmable content into shareable assets.
Key Roles Infographics Play in Marketing:
- Boost engagement and reduce bounce rate.
- Drive higher social media shares than text-only content.
- Simplify brand messaging, especially for technical or niche industries.
- Serve as lead magnets in downloadable guides or email campaigns.
- Increase the likelihood of being embedded and linked to by other websites.
The following are the ways how infographics can be helpful for your SEO:
Drive More Traffic
This type of visually engaging content is shared more on social media, blogs, and websites that all link back to your site.
Better Dwell Time
A well-designed infographic keeps people on your site longer, thereby increasing its dwell time, which is in part factored into rankings.
Get Backlinks
A beautiful infographic will attract many shares from other websites and, therefore, backlinks, which are assumed to be one of the primary factors that affect domain authority scores on search engines.
Benefits of Infographics in SEO

Infographics do more than just look good—they offer several tangible SEO benefits when used strategically.
Core SEO Benefits of Using Infographics:
Increase Backlinks
Unique, well-designed infographics naturally attract backlinks when shared or embedded by blogs, news sites, or resource pages.
Boost On-Page Time
Visual content improves user engagement, resulting in longer dwell times—an indirect signal of content value to search engines.
Enhance Indexability
Infographics with alt text, captions, and structured data improve image SEO and crawlability.
Target Long-Tail Keywords
Infographics often answer “how” or “what” questions, aligning well with informational search intent.
Win Featured Snippets
Paired with supporting content, infographics can help earn rich results like image carousels or snippet placements.
How Infographics Help Improve SEO?
Infographics are among the most shareable content types and easily earned backlinks, serving as authoritative seeds in your SEO. Now, let's understand how exactly infographics are good for SEO.
Increased Social Sharing
People love visual content. Users sharing your infographic on social media increases your brand's visibility and helps drive traffic back to your site.
Higher Engagement Rates
Infographics and other forms of visual content drive more engagement, as users are bound to stick around longer. They also improve your site's dwell time, making search engines feel this content is valuable.
Backlinks
Crafting a top-notch infographic is one way to receive backlinks from other sites, which often desire interactive content. The more backlinks you get for a website, the greater its domain authority, which helps to boost your rankings.
Better Rankings in Image Search
Properly optimized infographics can also appear in Google image search results, providing organic traffic. Add alt text and optimize the file name with target keywords.
Pro Tip: If infographics are in image format, they can still contribute to SEO if optimized properly. Use descriptive file names, relevant keywords in alt text, and captions. To enhance SEO value, embed the infographic within text-rich content and provide a detailed description for search engines to crawl and index effectively.
Quick Overview of Infographics Benefits in SEO
Here’s a comparison of SEO metrics influenced by infographics and how they perform:
|
SEO Metric |
Impact of Infographics |
|
Backlinks |
High-quality infographics often earn organic backlinks without outreach. |
|
User Engagement |
Visuals reduce bounce rate and improve time-on-page. |
|
Image Search Visibility |
Optimized infographics can rank in Google Images and drive extra traffic. |
|
Social Signals |
Shared widely on Pinterest, LinkedIn, Twitter, etc. |
|
Content Repurposing |
Infographics can be reused in carousels, presentations, or short videos. |
Different Types of Infographics
There's no such thing as a template infographic. It depends on the message you want to send. Here are eight popular types of infographics across industries.
Statistical Infographics
These are ideal for laying out content-rich information. They allow you to visualize statistics—charts, graphs, and numbers!
For: Showing survey results, Data trends/ Comparing data.
Process Infographics
Infographics, which represent step-by-step processes, can illustrate precisely and graphically all process components.
For: Workflows, how-to guides, product assembly instructions
Timeline Infographics
A timeline infographic represents events in order of time. It can be exciting to display historical information, project milestones, or plans for the future.
For: Company history, product development timelines, or event planning.
Comparison Infographics
These are infographics where two or more things can be compared in parallel. They often highlight the differences and similarities between products, services, or concepts.
For: Side-by-side product comparisons, Pros & Cons lists, or feature breakdowns.
Geographical Infographics
These infographics use maps and geographical data to present information on places, areas, or human populations.
For: Trendy market trends from around the world or regional stats and travel Guides.
Quick Overview of Infographics Types
Different messages require different types of visuals. Choosing the right format can significantly increase clarity and engagement.
|
Infographic Type |
Description |
Best Use Cases |
|
Statistical |
Visualizes numbers, charts, graphs |
Survey results, industry reports |
|
Timeline |
Shows events chronologically |
Company history, milestones |
|
Process |
Step-by-step or flowcharts |
How-to guides, tutorials |
|
Comparison |
Compares two or more items side-by-side |
Pros & cons, product A vs. B |
|
List |
Simplifies long lists into visual bullets |
Top tips, checklists |
|
Geographic (Map) |
Uses maps to show data by location |
Regional trends, market segmentation |
|
Hierarchical |
Displays levels of importance or structure |
Org charts, tiered content models |
|
Informational |
General explainer using icons and brief text |
Educational content, blog summaries |
How to Make an Infographic?
Now that you know the different types of infographics, let's explore how to create one.
Creating an infographic today is easier than ever, thanks to modern tools even if you’re not a designer.
Step-by-Step Guide to Creating an Infographic:
Step 1 - Choose Your Topic or Message
Decide what key insight or value you want to communicate.Step 2 - Gather Data or Insights
Use trusted sources like Statista, government databases, internal reports, or tools like Ahrefs for SEO-related stats.Step 3 - Pick the Right Format
Use the infographic type that best supports your message (timeline, process, list, etc.).Step 4 - Write Your Content Brief
Break the idea down into small, concise blocks that fit well into visual sections.Step 5 - Design the Infographic
Use drag-and-drop tools (see below) to create an engaging layout using icons, illustrations, charts, and branding.Step 6 - Optimize for SEO
- Name the image file appropriately (e.g., seo-benefits-infographic.png)
- Add alt text with keywords
- Compress the file size for faster page load
- Use descriptive file captions if embedded
Step 7 - Publish and Promote
Share it on your blog, distribute it across social media, email newsletters, and infographic submission directories.
Best Tools to Create Infographics
Here are some of the most popular and beginner friendly infographic design tools:
|
Tool |
Free Plan |
Best For |
Features |
|
Canva |
✅ |
Beginners & marketers |
Templates, drag-and-drop editor, brand kit, animations |
|
Piktochart |
✅ |
Data-driven infographics |
Graph tools, team collaboration, export as PDF or PPT |
|
Venngage |
✅ |
Business & academic use |
Charts, icons, templates, custom branding |
|
Adobe Express |
✅ |
Advanced creative control |
Animation, templates, Adobe integration |
|
Visme |
✅ |
Professional presentations |
Interactive infographics, dynamic charts, animations |
|
Infogram |
✅ |
Interactive data visualization |
Live charts, maps, real-time data embedding |
Top Infographic Submission Sites (For Backlinks & Reach)
Once your infographic is ready, submit it to these platforms to gain backlinks, referral traffic, and brand visibility.
|
Submission Site |
Type |
Authority (Est. DA) |
|
Visual.ly |
Community |
88 |
|
Infographic Journal |
Directory |
59 |
|
Reddit (Infographics) |
Social/Forum |
91 |
|
|
Social Media |
94 |
|
Daily Infographic |
Blog |
60 |
|
Infographics Showcase |
Gallery |
55 |
|
SlideShare |
Presentation |
95 |
|
Behance |
Portfolio |
92 |
|
Dribbble |
Portfolio |
89 |
Pro Tip: When submitting, always include a short description, link to your original blog post, and use keyword-rich tags and titles.
How to Make a Good Infographic?
Infographics simplify information. Here are a few tips:
- Be Concise: Avoid cramming too much information and concentrate on the main key points.
- Visual Clarity: Using graphics, icons, and charts to illustrate your data without overcomplicating it. Clarity should be your purpose, not confusion.
- Select a Color Palette: Colour can stir feelings and passion. Keep your color palette harmonious for the look and feel; it should be easy on the eye and reflect nicely on your brand.
- Clear Fonts: Use simple, clear fonts that are easily read across different devices.
- Include a CTA: After reading the infographic, invite your readers to visit the website, post, or download more helpful content.
Good Infographic Checklist:
- One clear message or story
- Organized into logical sections or steps
- Uses consistent and branded design
- Contains accurate, up-to-date data
- Includes your logo or website URL for credit
- Mobile-responsive and lightweight
- Contains relevant SEO tags, file name, and alt text
5 Examples of Effective Infographics
Real-world examples help illustrate how infographics work in different contexts. Below are some common infographic styles with use cases:
1. Timeline Infographic

Example: “History of SEO: From 1991 to 2026”
- Displays events or changes over time in chronological order.
- Great for storytelling or showing evolution.
2. Comparison Infographic
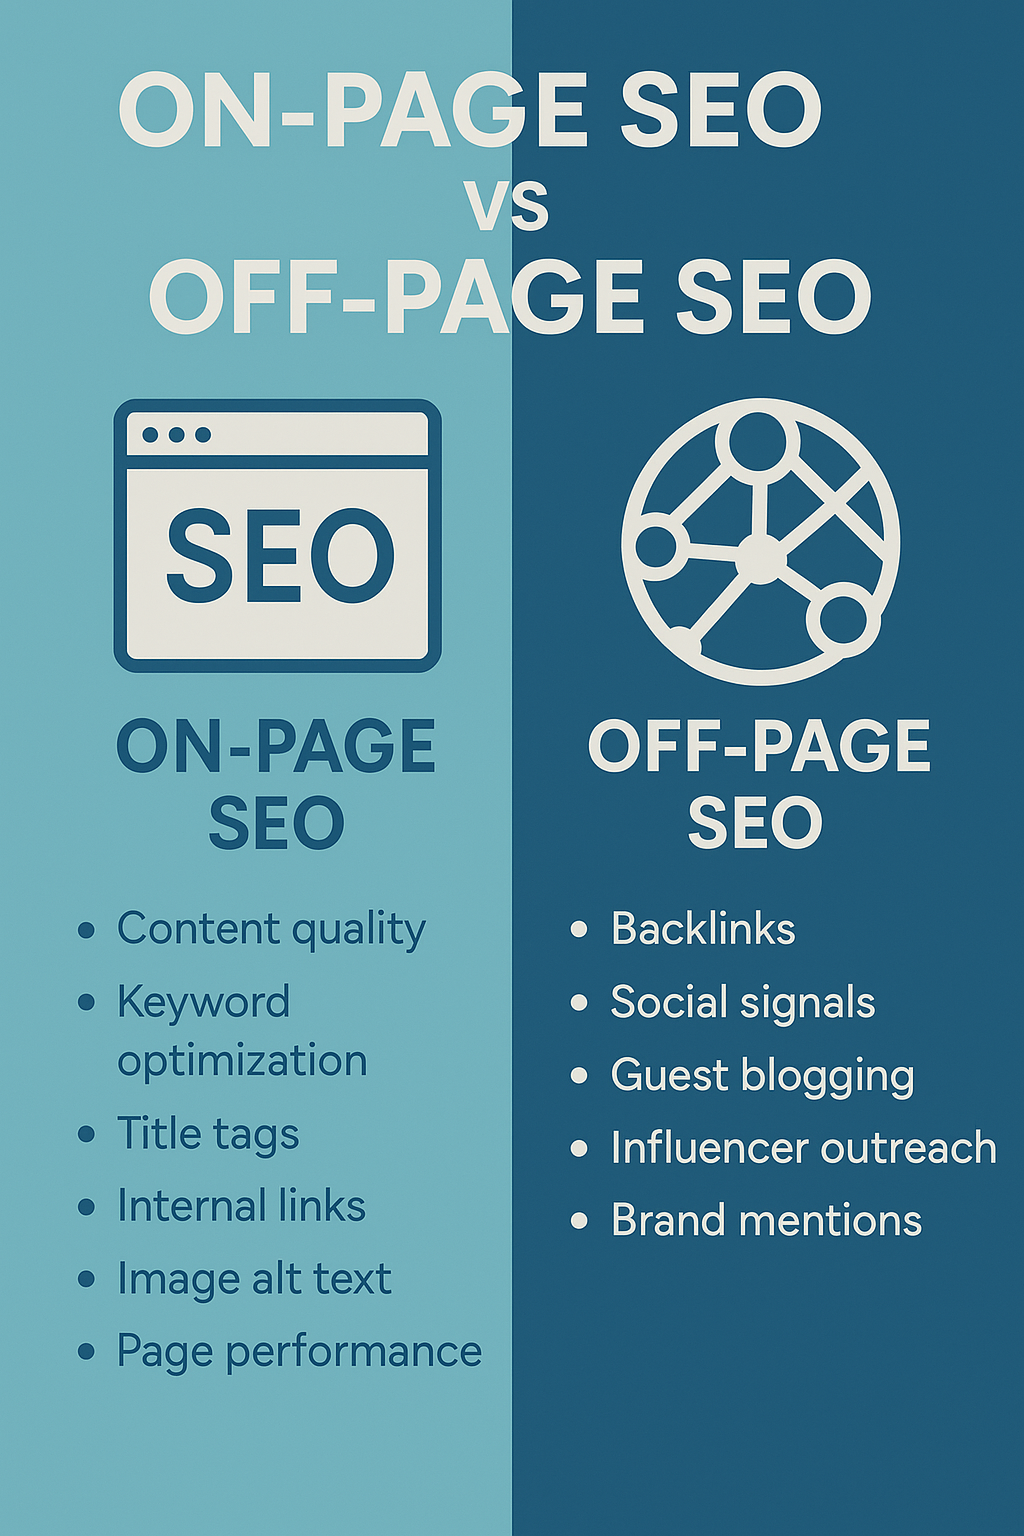
Example: “On-Page SEO vs Off-Page SEO”
- Visually compares two products, services, or concepts side by side.
- Ideal for pros/cons or before vs after scenarios.
3. Process Infographic

Example: “6 Steps to Launch a WordPress Website”
- Breaks down a task into clear, sequential steps.
- Works well for guides, SOPs, or how-tos.
4. Statistical Infographic
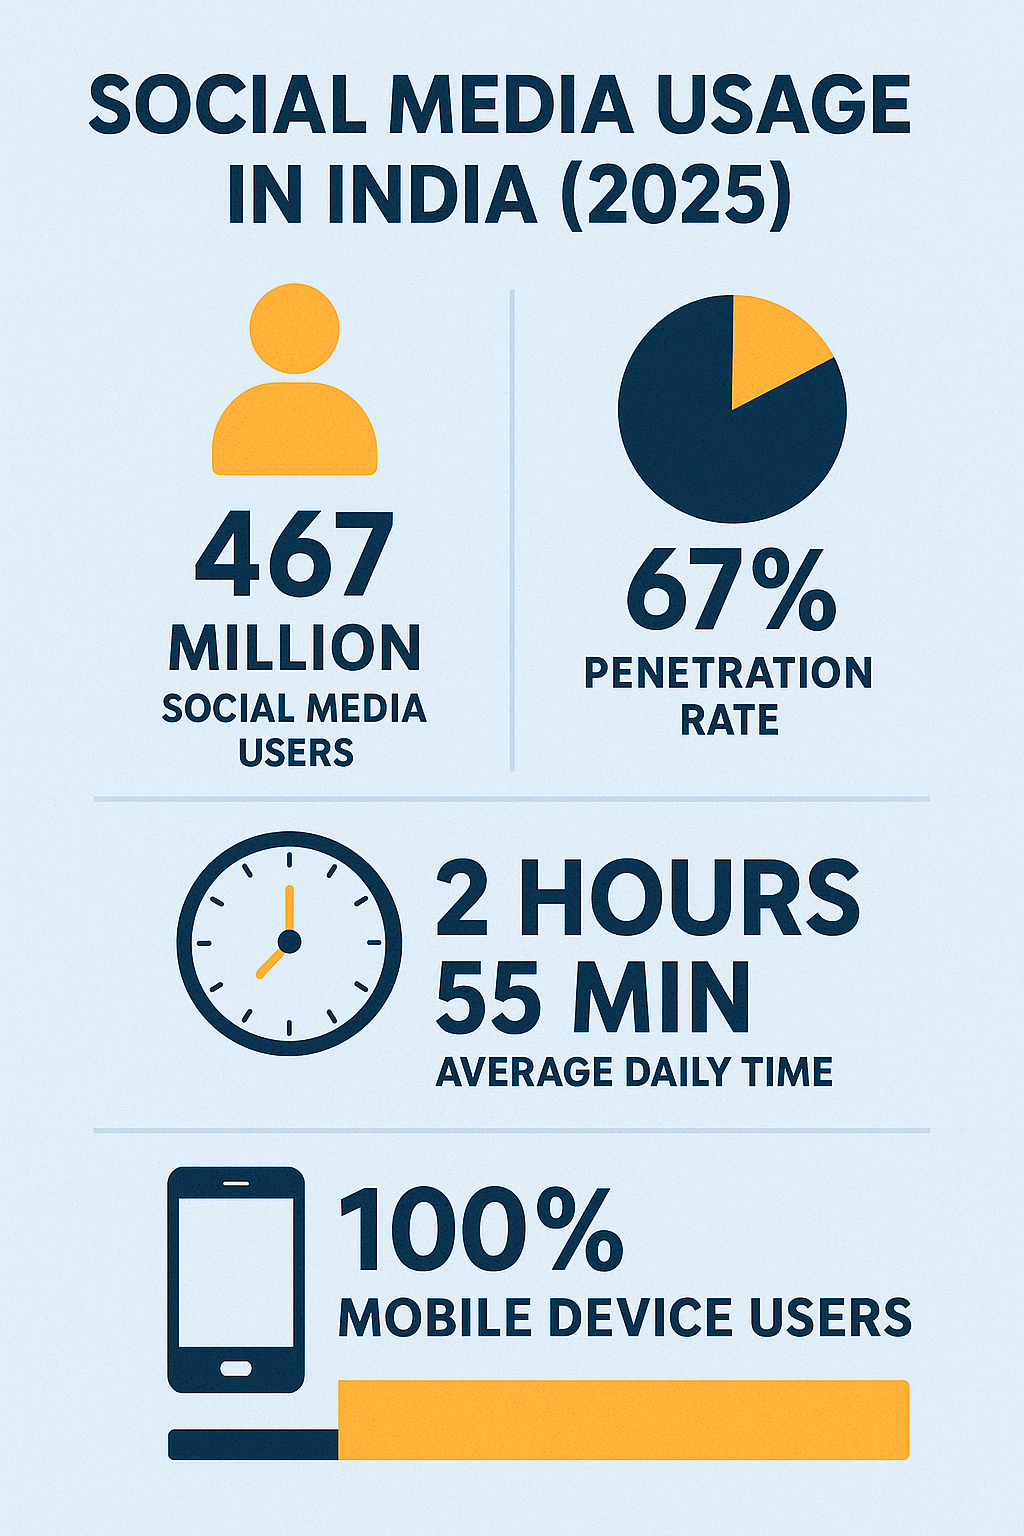
Example: “Social Media Usage in India (2026)”
- Showcases data-driven insights using charts, graphs, and icons.
- Useful in research, surveys, or industry reports.
5. List Infographic

Example: “10 Google Ranking Factors You Must Know”
- Transforms long-form bullet points into a scannable format.
- Works great for blog summaries or listicles.
Core Elements of an Infographic
An effective infographic balances form and function. These are the must-have components of any well-designed infographic:
|
Headline |
Grabs attention and clearly explains the infographic’s focus |
|
Subheading/Intro |
Provides context for the data or story being visualized |
|
Data or Key Info |
Core information supported by facts, stats, or steps |
|
Visuals |
Icons, charts, graphs, illustrations that support and clarify the data |
|
Layout/Structure |
Logical flow from top to bottom or left to right |
|
Color Scheme |
Reinforces branding and ensures readability |
|
Branding Elements |
Logo, website URL, CTA (Call-To-Action) to encourage engagement |
|
Sources/Credits |
Shows credibility by citing where data is from |
Pro Tip: Don’t overload your infographic use whitespace, balance text-to-visual ratio, and ensure all elements have breathing room.
Standard Infographic Sizes (Web, Social, Print)
Depending on the platform or purpose, infographic dimensions vary. Use these common size formats for best results:
|
Use Case |
Recommended Size |
Description |
|
Vertical (Web Blog) |
800×2000+ px |
Ideal for blog posts and scrolling content |
|
Social Media Post |
1080×1080 px (square) |
Best for Instagram, Facebook, LinkedIn |
|
|
1000×1500 px or longer |
Vertical pins get more repins |
|
Twitter/X |
1200×675 px |
Landscape for cards |
|
Print (A4) |
2480×3508 px (300 DPI) |
High-resolution for printed documents |
|
SlideShare/Presentation |
1024×768 px |
Landscape for slideshows or deck formats |
Tools like Canva and Visme offer ready-made templates in these sizes to simplify your workflow.
Why should you start using infographics?
Infographics are another strong format that makes complicated information really digestible and excites your audience. Users can quickly grasp the gist of the key points in a campaign by combining visuals, text, and data. They have high shareability on social media, enabling more exposure for your content and creates more traffic to your site. Furthermore, due to their eye-catching format, they are such a no-brainer in keeping users engaged, so they increase your dwell time on your site, which benefits SEO.
Reasons to Start Now:
- People remember visuals 6X more than text
- They earn more backlinks and shares than regular content
- They support both branding and SEO goals
- They boost visibility across search, social, and email
- They establish your authority in your niche
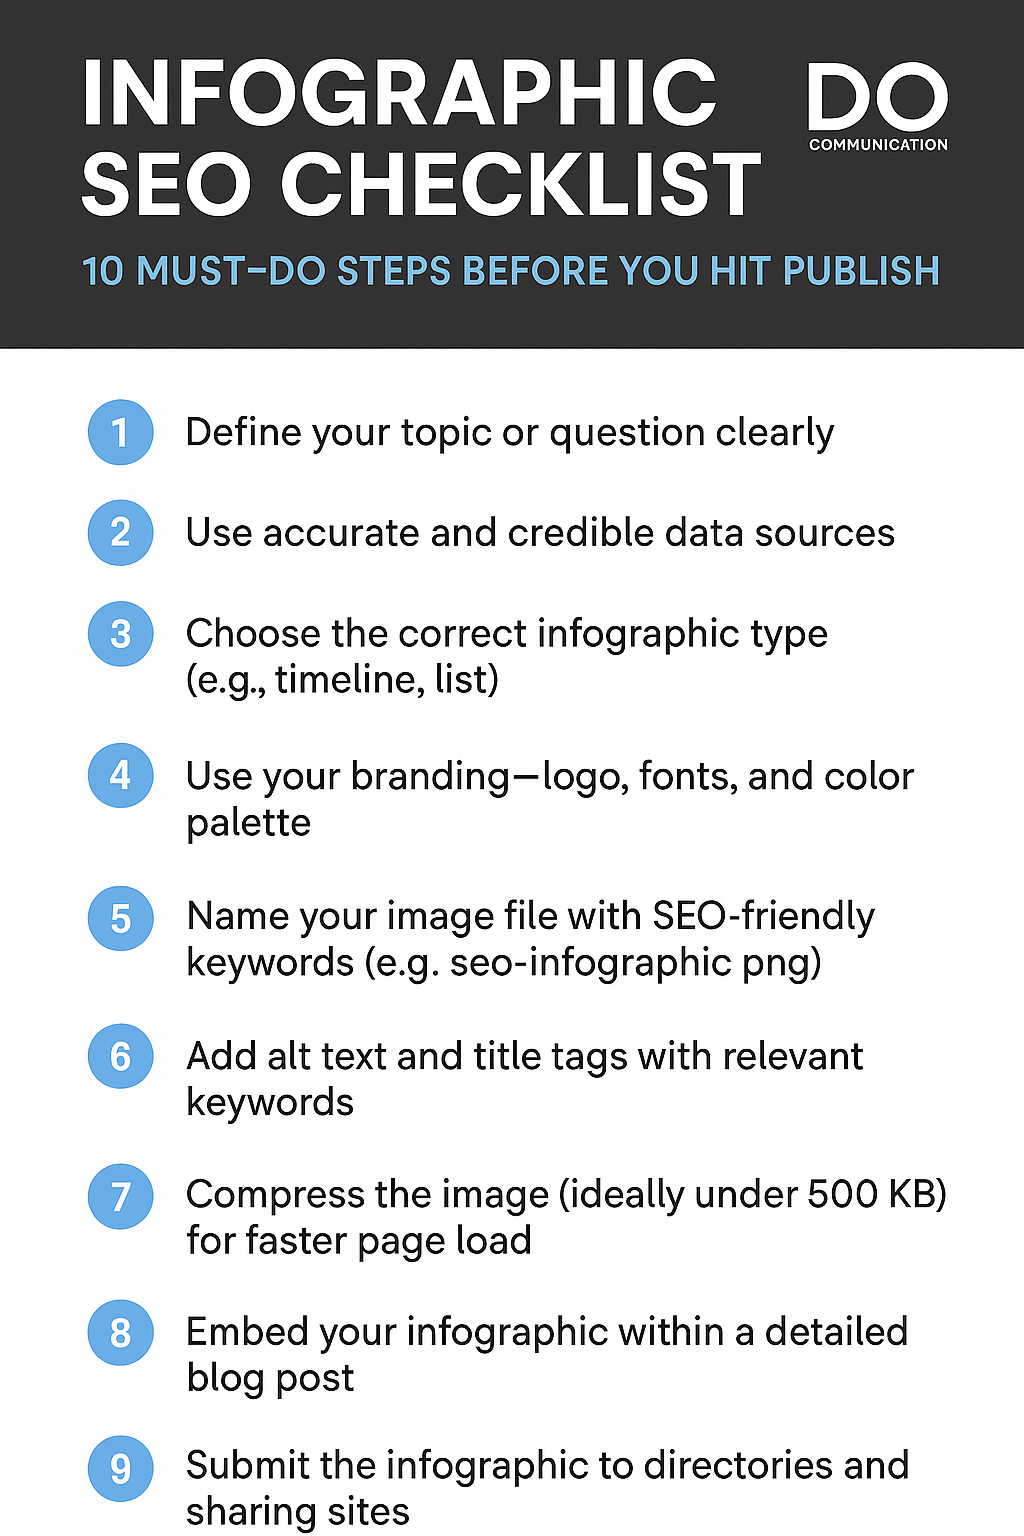
Infographic SEO Checklist: 10 Must-Do Steps Before You Hit Publish
|
Step |
Checklist Item |
|
1 |
Pick a focused topic or question to answer. |
|
2 |
Use reliable, accurate, and recent data. |
|
3 |
Choose the right infographic type (timeline, list, comparison, etc.). |
|
4 |
Use consistent branding – logo, fonts, color scheme. |
|
5 |
Write a keyword-rich file name (e.g., seo-benefits-infographic.png). |
|
6 |
Add alt text and image title tag with relevant keywords. |
|
7 |
Compress image to reduce file size (under 500kb ideally). |
|
8 |
Publish the infographic on your blog with explanatory content. |
|
9 |
Submit to infographic directories and image-sharing platforms. |
|
10 |
Promote across social media, newsletters, and embed on other blogs. |
Conclusion
Infographics have an incredible way of simplifying complex data, getting your audience engaged, and helping you optimize search engine results at the same time. These mediums of communicating information through infographics make them a powerful tool for content marketing if only you knew what infographic design is, the types of infographics, and how to make an infographic in a way that stands out. When done right, an infographic gives your audience something, and that reflection will be in the search engines, too, so it is a win-win for you. You can take the final results to another level by using your technical SEO services on what you made for your infographics.
FAQs About Infographics & SEO
Q1. What is an infographic?
Ans: An infographic is a way of visually representing information that combines text, images, and graphics to present data or explain an idea in an easy-to-understand manner.
Q2. Are infographics still effective for SEO in 2026?
Ans: Absolutely. Infographics remain one of the most effective content formats for earning backlinks, increasing engagement, and improving visual search performance. When well-designed and promoted, they can significantly support your SEO efforts in 2026 and beyond.
Q3. Do infographics directly affect search rankings?
Ans: While infographics themselves don’t directly improve rankings, their indirect impact is powerful. They help generate backlinks, increase dwell time, reduce bounce rate, and drive social shares all of which contribute positively to SEO.
Q4. Can I create infographics without a graphic designer?
Ans: Yes. Tools like Canva, Venngage, and Piktochart allow anyone even without design experience to create professional-looking infographics using drag-and-drop editors and pre-made templates.
Q5. How do I optimize infographics for search engines?
- Use descriptive file names (e.g., seo-infographic.png)
- Add keyword-rich alt text
- Compress images for faster load speed
- Include surrounding context in the content
- Submit to Google Search Console as part of your image sitemap if needed
Q6. Where can I share my infographics for better visibility?
Ans: You can share infographics on Pinterest, LinkedIn, Twitter, Reddit, and infographic directories like Visual.ly, Infographic Journal, and SlideShare. Always link back to your original blog post for SEO benefits.
Q7. What are the benefits of infographics for SEO?
Ans: It can generate increased web traffic and backlinks to the site, ultimately improving your page's position in Google search engine results.
Q8. How can I make a good infographic?
Ans: A good infographic should be attractive, concise, and informative. It should also have good visuals and a defined color scheme and add CTAs to increase user engagement.
Q9. Why are infographics effective?
Ans: Infographics work because they communicate visually, which makes it easier to digest and retain information. They also communicate authority and expertise, and thus, they have become one of the most dominant content marketing and SEO tools.
Q10. Are infographics suitable for all types of content?
Ans: Infographics suit almost any content, so they work great with educational/promotional content and even data presentations.