
Google Looker Studio, formerly known as Google Data Studio, is a powerful tool for visualizing Google Analytics data. Its user-friendly interface and interactive features make it invaluable for beginners and experts alike. With Looker Studio, users can easily connect to various data sources, create customizable reports, and share insights with colleagues. Unlike traditional reporting tools, Looker Studio offers real-time collaboration and dynamic dashboards for a more engaging data analysis experience. Best of all, Looker Studio is free to use, making advanced analytics accessible to businesses and individuals of all sizes. Whether you're just starting or refining your skills, Looker Studio is your compass in the vast ocean of data.
Have you ever felt overwhelmed by the sheer volume of data available in Google Analytics? In the digital age, data is akin to a vast ocean, brimming with insights just beneath the surface. Yet, without the right tools, diving into this ocean can be daunting. Enter Google Looker Studio – the compass and map that guides you through the depths of data, transforming complex analytics into clear, actionable insights.
But why Looker Studio? Did you know that humans are visual creatures, with nearly 50% of our brain involved in visual processing? It's no wonder that visualizing data can make it significantly easier to comprehend and act upon. This is where Google Looker Studio shines, allowing even beginners to create interactive, visually compelling reports that make data come alive.
Are you new to this tool or simply looking to refine your skills? Whether you're a marketer, a business owner, or a data enthusiast, our comprehensive guide is your gateway to mastering this powerful platform. From setting up your first report to exploring advanced visualization techniques, we'll navigate you through the best ways to harness the power of your Google Analytics data.
Table of Contents |

What Exactly Is Google Looker Studio?
Before we dive into simple tutorials to get you started with Looker Studio, let’s get a clear picture of the services the platform offers:
What is Looker Studio?
Looker Studio, formerly known as Google Data Studio, is a robust and user-friendly tool designed to transform raw data into comprehensible, interactive reports and dashboards. It acts as a bridge between the complexity of data analytics and the simplicity of visual storytelling, enabling users to derive actionable insights from their data.
Brief History and Evolution from Google Data Studio to Looker Studio
The journey from Google Data Studio to Looker Studio is a tale of continuous innovation and enhancement. Initially launched as Google Data Studio in 2016, the platform was Google's answer to the growing need for accessible data visualisation tools.
It democratised data analysis, allowing users with varying degrees of technical expertise to create detailed and interactive reports. As the platform evolved, it expanded its capabilities, embracing a broader range of data sources and advanced visualisation options. In a significant leap forward, the rebranding to Looker Studio marked the integration with Google's more powerful analytics tool, Looker, further strengthening its position as a comprehensive data exploration solution.
Key Features and Benefits of Using Looker Studio for Data Visualization
Looker Studio is equipped with an array of features that make it a preferred choice for data visualisation:
- Diverse Data Connectivity: Looker Studio can connect with an extensive variety of data sources, including Google's suite of products and third-party platforms, ensuring a seamless flow of data into your reports.
- Intuitive Interface: The drag-and-drop interface simplifies the creation of custom reports and dashboards, making it accessible even for beginners.
- Real-time Collaboration: Like other Google tools, Looker Studio supports real-time collaboration, allowing teams to work together on data analysis projects from anywhere in the world.
- Customizable Visualisations: Users can choose from a wide range of charts, graphs, and tables to represent their data most effectively, tailoring the look and feel to their specific needs.
- Interactive Reports: The dynamic and interactive nature of Looker Studio reports encourages deeper exploration of data, with features like drill-downs and filter controls.
- No Cost Barrier: Looker Studio is available for free, making advanced data visualisation accessible to businesses and individuals without a significant investment.
In essence, Looker Studio stands out as a powerful ally in the realm of data visualization, offering flexibility, ease of use, and comprehensive features that cater to the needs of data analysts and business professionals alike.
Google Data Studio Tutorial for Beginners
Embarking on your data visualisation journey with Looker Studio can be both exciting and a bit daunting. Fear not, for this beginner's tutorial will guide you through the essential steps to transform your data into insightful visual stories.
Step 1: Accessing and Setting up Looker Studio
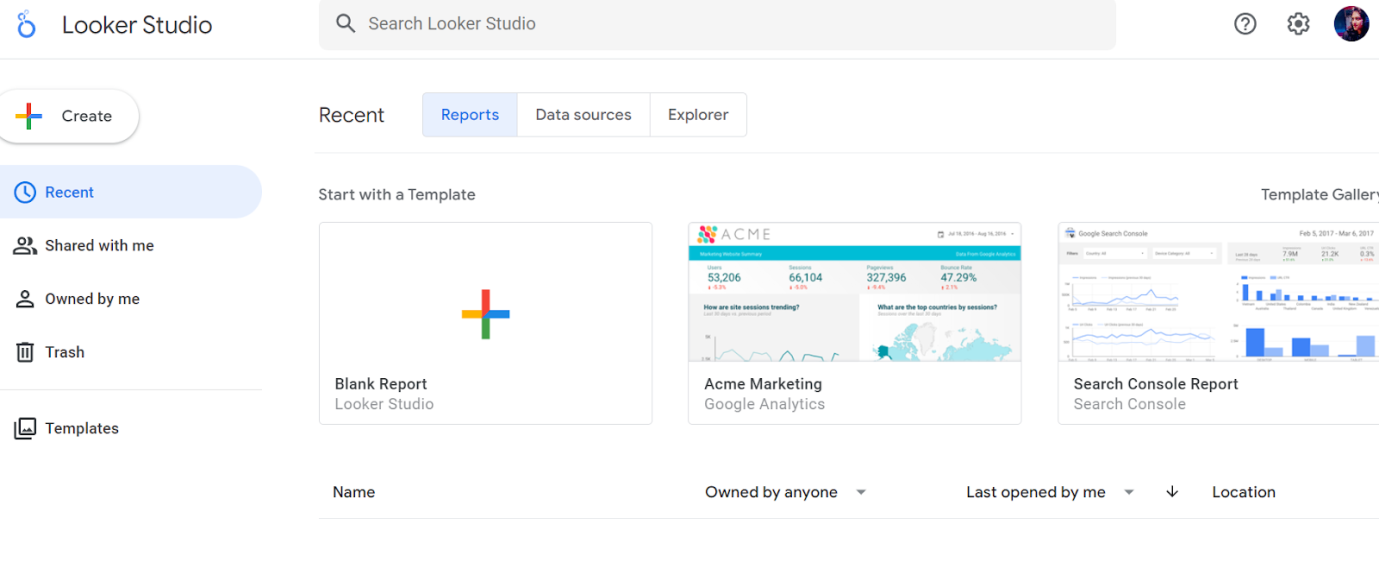
Your first port of call is the Looker Studio website. If you have a Google account, you're already halfway there. Sign in with your credentials, and you'll be greeted by the Looker Studio homepage. Here, you can explore templates or start fresh with a "New Report."
Step 2: Connecting to Google Analytics Data Source
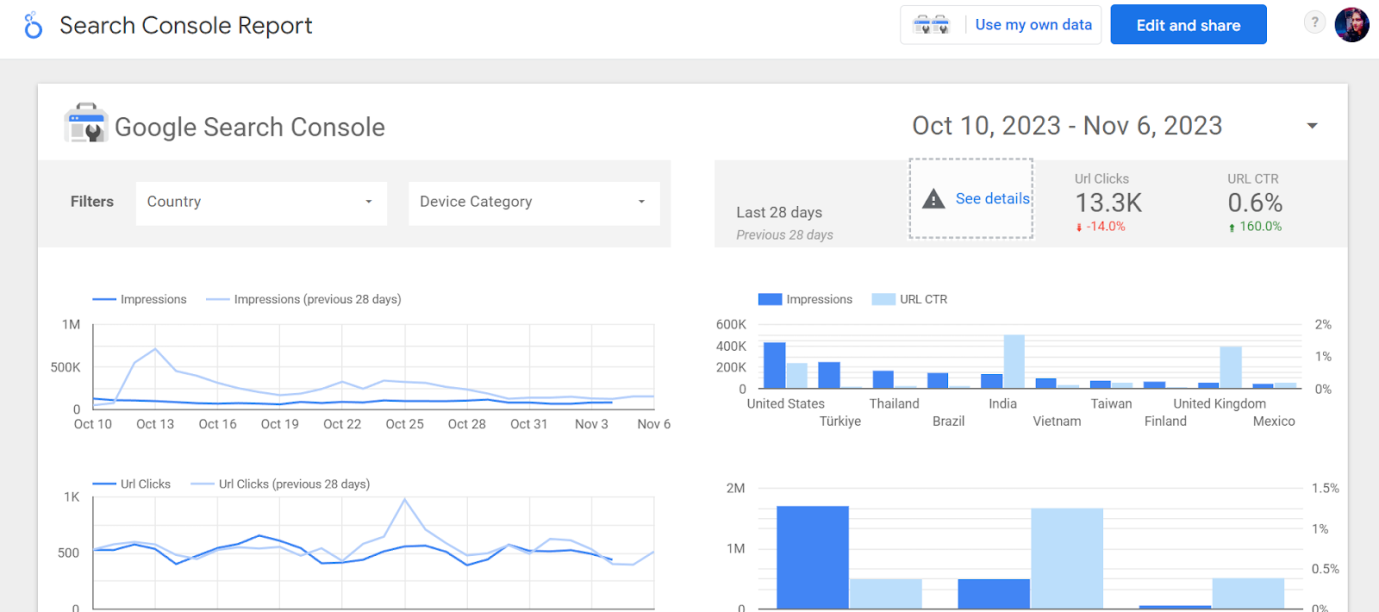
Data is the lifeblood of any report. To connect your Google Analytics data, click on "Create" and then "Data Source." Look for the Google Analytics connector, and authorize it to access your account. Once connected, select the relevant account, property, and view. With the data source in place, you're ready to channel this stream of data into your report.
Step 3: Navigating the Looker Studio Interface
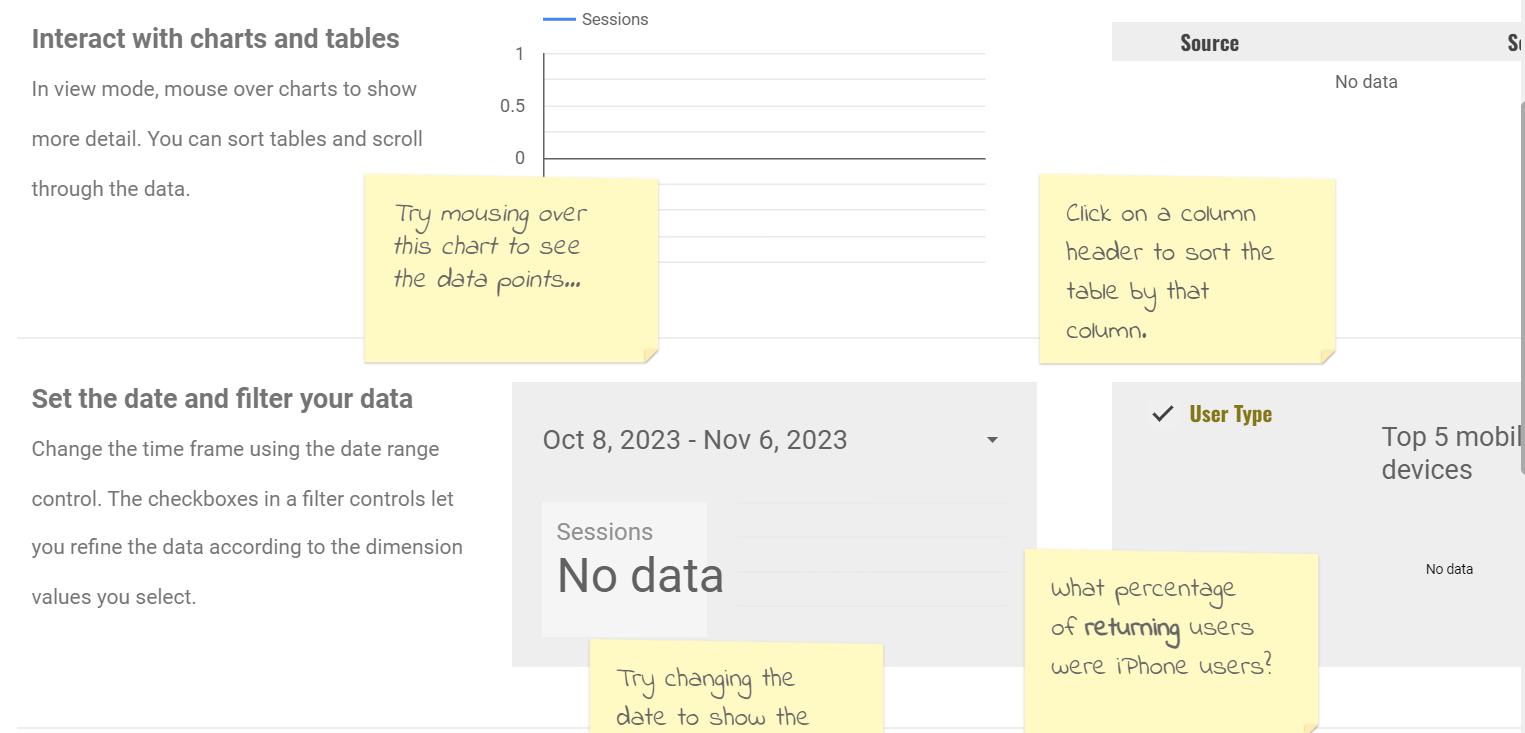
The Looker Studio interface is your canvas and control panel rolled into one. The left sidebar is your toolbox, housing your data sources, and various visualization widgets. The top bar provides options for layout, style, and themes, while the right sidebar is where the magic happens – here, you can fine-tune your charts and widgets once they're on your canvas.
Step 4: Creating Your First Report
Dive into creating your first report by clicking on "Blank Report" from the homepage. You'll be prompted to add a data source – you can choose the one you've just set up. Once added, it's time to drag and drop widgets from the toolbar onto your canvas. From simple tables to complex geo maps, select the one that best fits the story you're trying to tell with your data.
Step 5: Basic Customization and Visualization Tips
A report that communicates effectively is both clear and appealing. Start with a basic chart, like a bar graph or line chart. Click on the chart to bring up the properties panel, where you can assign dimensions (what) and metrics (how much). Experiment with color schemes and fonts to make your data stand out, but remember – clarity is key. Use filters for more precise data representation, and don't shy away from tooltips and interaction controls to make your report not just a static picture, but a dynamic exploration tool.
Looker vs. Data Studio
Looker and Data Studio are both business intelligence (BI) tools from Google Cloud, but they have different strengths and use cases. Looker is a more powerful and enterprise-grade BI platform, while Data Studio is a more self-service and user-friendly BI tool.
|
|
|
|
|
|
|
|
|
|
|
|
|
|
|
|
|
|
|
|
|
|
|
|
Also Read: How to Optimize Your Google Profile to Grow Your Business in 2024
When to use Looker vs. when to use Data Studio
Looker is a good choice for organisations that need a powerful and enterprise-grade BI platform. It is well-suited for organisations with large and complex datasets, and for organisations that need to create custom data models and reports. Looker is also a good choice when there is a need to use its embed BI capabilities.
Data Studio is a good choice for organisations that need a more self-service and user-friendly BI tool. It is well-suited for organisations with smaller and less complex datasets, and for those that need to create basic reports and dashboards quickly and easily. Data Studio is also a good choice for organisations that need to share reports and dashboards with non-technical users.
Here are some specific examples of when you might choose to use Looker vs. Data Studio:
Use Looker when:
- You need to create custom data models and reports.
- You need to embed BI capabilities into your own applications or products.
- You have large and complex datasets.
- You need advanced reporting features, such as dynamic filters and calculated fields.
Use Data Studio when:
- You need a self-service and user-friendly BI tool.
- You have smaller and less complex datasets.
- You need to create basic reports and dashboards quickly and easily.
- You need to share reports and dashboards with non-technical users.
How to Use Looker Studio
Looker Studio isn't just for simple data visualizations; it's a tool that can handle complex datasets and create dynamic reports. Here's how you can harness its advanced features to turn raw data into compelling narratives.
Advanced Data Connection Options
While connecting to Google services is straightforward, Looker Studio also supports advanced data sources like BigQuery, SQL databases, and even flat files like CSVs. You can blend data from different sources, providing a comprehensive view of your metrics. Additionally, Looker Studio allows you to create calculated fields and parameters, enabling complex data manipulations and custom metrics directly within your reports.
Exploring Various Chart Types and Visualization Tools
Looker Studio offers a plethora of chart types, from basic bar and line charts to more complex geo maps and scatter plots. Each chart type has its unique way of telling a story. Don't hesitate to explore the less common visualisations like treemaps or radar charts, which can reveal insights that more traditional charts might miss.
Tips for Designing Effective Dashboards
An effective dashboard communicates key insights at a glance. To achieve this, maintain a clean and organised layout. Group related metrics together, and use consistent colour schemes for easy interpretation. Leverage text and shapes for clarity and context, and ensure your most important data stands out. Remember, a good dashboard is not just about displaying data; it's about communicating information.
Sharing and Collaboration Features
One of Looker Studio's strengths is its collaboration capabilities. You can share your reports with teammates or stakeholders, granting them view or edit access just like a Google Doc. This facilitates a collaborative approach to data analysis and decision-making, ensuring everyone is on the same page.
Utilising Filter Controls for Dynamic Reports
Static reports have their place, but dynamic reports allow users to interact with the data. Utilise Looker Studio's filter controls to add interactivity to your reports. Viewers can filter data based on dimensions like date ranges, products, or geographic locations. This not only makes your reports more engaging but also empowers users to explore the data in a way that's relevant to them.
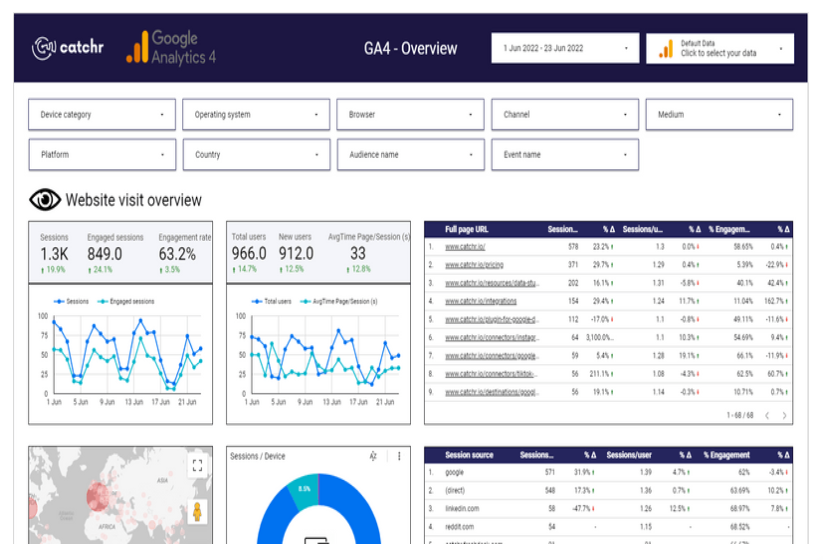
GA4 Studio Template
Google Analytics 4 (GA4) is a new analytics platform that is designed to help businesses measure all of their customer interactions across devices and platforms. GA4 offers a number of advantages over the previous version of Google Analytics, including:
- Cross-platform measurement: GA4 can track users across devices and platforms, giving businesses a more complete view of their customer journey.
- Event-based data model: GA4 uses an event-based data model, which allows businesses to track any type of user interaction as an event. This gives businesses more flexibility in how they measure their data.
- Machine learning insights: GA4 uses machine learning to provide businesses with insights into their data, such as predicting customer churn and identifying anomalies.
Benefits of using pre-built GA4 templates in Looker Studio
Looker Studio is a data visualisation tool that can be used to create reports and dashboards from GA4 data. Pre-built GA4 templates in Looker Studio can help businesses to get started with GA4 quickly and easily. These templates provide a number of benefits, including:
- They are pre-configured with the most important GA4 metrics and dimensions.
- They are easy to customise to meet the specific needs of your business.
- They can save you time and effort in creating reports and dashboards.
Where to find GA4 templates and how to implement them
There are a number of places where you can find pre-built GA4 templates for Looker Studio. One good place to start is the Looker Studio community gallery. Here you will find a variety of templates created by other users, including GA4 templates.
To implement a GA4 template in Looker Studio, simply create a new report and select the template you want to use. You can then customise the template to meet your specific needs.
Here are some tips for implementing a GA4 template in Looker Studio:
- Make sure that you have connected your GA4 property to Looker Studio.
- If you are using a template that was created for a previous version of GA4, you may need to update the template to reflect the changes in GA4.
- Be sure to test the template before you share it with others.
Pre-built GA4 templates in Looker Studio can be a great way to get started with GA4 and to create reports and dashboards quickly and easily.
Data Studio for Reporting
Creating impactful reports in Looker Studio requires not just an understanding of data, but also an awareness of best practices that make your reports more effective and user-friendly.
Best Practices for Creating Reports in Looker Studio
Clarity and simplicity are the cornerstones of a good report. Start with a clear objective and choose visualisations that best convey your message. Use consistent design elements and limit the colour palette to avoid visual clutter. Annotations and concise text can provide context, making your data more understandable.
Customising Reports for Different Audiences
Remember that not all audiences are the same. A report for executives might need high-level KPIs, while a technical team might require more detailed analytics. Customise the level of detail and complexity based on who will be using the report. Leverage Looker Studio's theme and layout options to tailor the aesthetic elements to match the branding or preferences of your audience.
Automating Report Updates and Scheduling
One of Looker Studio’s most powerful features is the ability to automate data refreshes and report updates. This ensures your reports always display the most recent data without manual intervention. You can also schedule automated emails to send updated reports to stakeholders, keeping everyone informed with the latest insights.
Examples of Powerful Reporting Use Cases
From marketing campaign analysis to financial reporting, Looker Studio serves a broad range of use cases. For instance, e-commerce businesses can track sales and customer behaviour in real-time, while educational institutions might monitor student performance and engagement metrics. The versatility of Looker Studio makes it an invaluable tool across industries.
Charting Your Data Journey with Looker Studio
Google Looker Studio emerges as a beacon in the realm of data visualization, guiding users through the dense fog of analytics to uncover hidden insights. Whether you're a novice just dipping your toes in or an expert seeking to refine your skills, Looker Studio offers an expansive toolkit to transform data into compelling narratives.
Embrace the power of this platform and embark on a journey where data doesn't just inform but tells stories, influences decisions, and drives change. Your voyage through the vast sea of Google Analytics data begins with Looker Studio – chart your course wisely and discover the treasures hidden within your numbers.
Also Read: Google Launches New 'Saved Comparisons' Feature For Analytics
Conclusion
In the vast ocean of data, Google Looker Studio emerges as a guiding compass, transforming complex analytics into actionable insights. Visualizing data becomes effortless with Looker Studio, catering to beginners and seasoned professionals. From connecting to diverse data sources to creating interactive reports, Looker Studio stands out with its intuitive interface and real-time collaboration features. For assistance and queries, reach out to DO Communications.
Frequently Asked Questions
Q1. What is Looker Studio?
Looker Studio, previously known as Google Data Studio, is a free data visualization and reporting tool offered by Google. It allows users to convert data into customizable informative reports and dashboards, making it easier to analyze, visualize, and share data from Google Analytics and other data sources.
Q2. How does Looker Studio integrate with Google Analytics?
Looker Studio seamlessly integrates with Google Analytics. Users can connect their Google Analytics accounts as a data source in Looker Studio, allowing them to pull in metrics and dimensions directly into their reports and dashboards for a more visual and interactive data analysis experience.
Q3. Can Looker Studio be used by beginners?
Absolutely! Looker Studio is designed with an intuitive, user-friendly interface that caters to both beginners and advanced users. Its drag-and-drop features, pre-built templates, and detailed tutorials make it accessible for individuals new to data visualization.
Q4. What makes Looker Studio different from traditional reporting tools?
Looker Studio stands out due to its real-time data integration, collaborative features, and interactive reports. Unlike traditional static reports, Looker Studio's dynamic dashboards allow for an interactive data exploration experience, making it a more engaging and insightful tool for decision-making.
Q5. Is Looker Studio free to use?
Yes, Looker Studio is completely free. It provides powerful data visualization capabilities without any cost, making advanced analytics accessible to businesses and individuals who may not have the resources for expensive software solutions.